When `reorder` Fails
Jul 13, 2024· ·
2 min read
·
2 min read
Shonn Cheng
I am using the mpg dataset included in the ggplot2 package.
   #load packages
   library(tidyverse)
   library(tidytext)

    #view data
    mpg
    ## Rows: 234
    ## Columns: 11
    ## $ manufacturer <chr> "audi", "audi", "audi", "audi", "audi", "audi", "audi", "…
    ## $ model        <chr> "a4", "a4", "a4", "a4", "a4", "a4", "a4", "a4 quattro", "…
    ## $ displ        <dbl> 1.8, 1.8, 2.0, 2.0, 2.8, 2.8, 3.1, 1.8, 1.8, 2.0, 2.0, 2.…
    ## $ year         <int> 1999, 1999, 2008, 2008, 1999, 1999, 2008, 1999, 1999, 200…
    ## $ cyl          <int> 4, 4, 4, 4, 6, 6, 6, 4, 4, 4, 4, 6, 6, 6, 6, 6, 6, 8, 8, …
    ## $ trans        <chr> "auto(l5)", "manual(m5)", "manual(m6)", "auto(av)", "auto…
    ## $ drv          <chr> "f", "f", "f", "f", "f", "f", "f", "4", "4", "4", "4", "4…
    ## $ cty          <int> 18, 21, 20, 21, 16, 18, 18, 18, 16, 20, 19, 15, 17, 17, 1…
    ## $ hwy          <int> 29, 29, 31, 30, 26, 26, 27, 26, 25, 28, 27, 25, 25, 25, 2…
    ## $ fl           <chr> "p", "p", "p", "p", "p", "p", "p", "p", "p", "p", "p", "p…
    ## $ class        <chr> "compact", "compact", "compact", "compact", "compact", "c…
    mpg %>%
      group_by(trans) %>%
      count() %>%
      ungroup() %>%
      ggplot(mapping = aes(trans, n)) +
      geom_bar(stat = "identity")
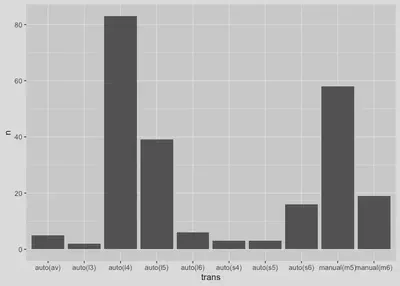
This plot is ok, but how about arranging the order of trans by frequency? We can use reorder.
    mpg %>%
      group_by(trans) %>%
      count() %>%
      ungroup() %>%
      ggplot(mapping = aes(reorder(trans, n), n)) +
      geom_bar(stat = "identity")
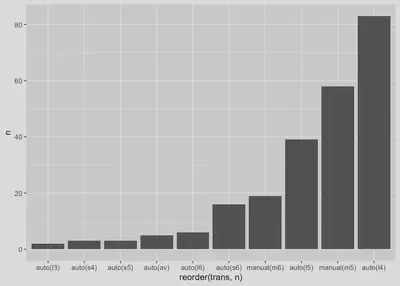
Ok, this is what we want. Let’s work with a more complicated example. We want the distribution of trans varied by drv.
    mpg %>%
      group_by(drv, trans) %>%
      count() %>%
      ungroup() %>%
      ggplot(mapping = aes(reorder(trans, n), n)) +
      geom_bar(stat = "identity") +
      facet_wrap(~ drv, scale = "free")

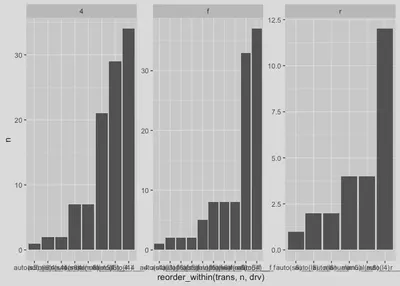
reorder doesn’t work well with a third-dimension variable. Use
reorder_within (in tidytext package) instead
    mpg %>%
      group_by(drv, trans) %>%
      count() %>%
      ungroup() %>%
      ggplot(mapping = aes(reorder_within(trans, n, drv), n)) +
      geom_bar(stat = "identity") +
      facet_wrap(~ drv, scale = "free")